
Credits: NASA/Saskia Madlener
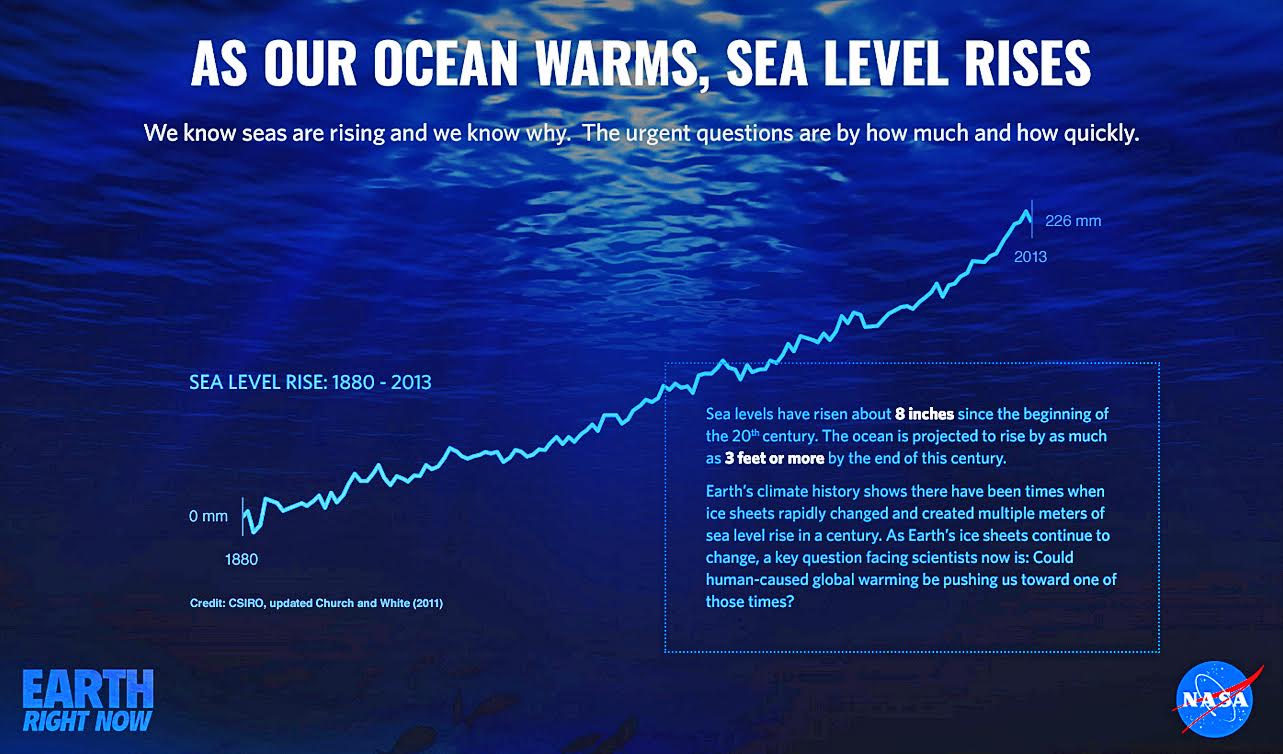
“For thousands of years, sea level has remained relatively stable and human communities have settled along the planet’s coastlines. But now Earth’s seas are rising. Globally, sea level has risen about eight inches since the beginning of the 20th century and more than two inches in the last 20 years alone. All signs suggest that this rise is accelerating.” – NASA Earth Science News Aug. 26, 2015
Once, covering a story on a NASA/JPL spacecraft designed to study how ocean and atmosphere interact to create weather patterns, I asked NASA Project Scientist Yi Chao if salty was good? The clear logic of his answer caught me off guard.
“There’s no such thing as absolute good or bad, right? In certain areas, you want to monitor the change, that’s really the key. You want to see whether the area’s freshwater gets fresher, you know, and if the salty water gets saltier. That represents the speeding up or slowing down of the water cycle. So you ask the questions: do we have more evaporation as we change the climate? Do we have more freshwater melting? All these questions are related.”
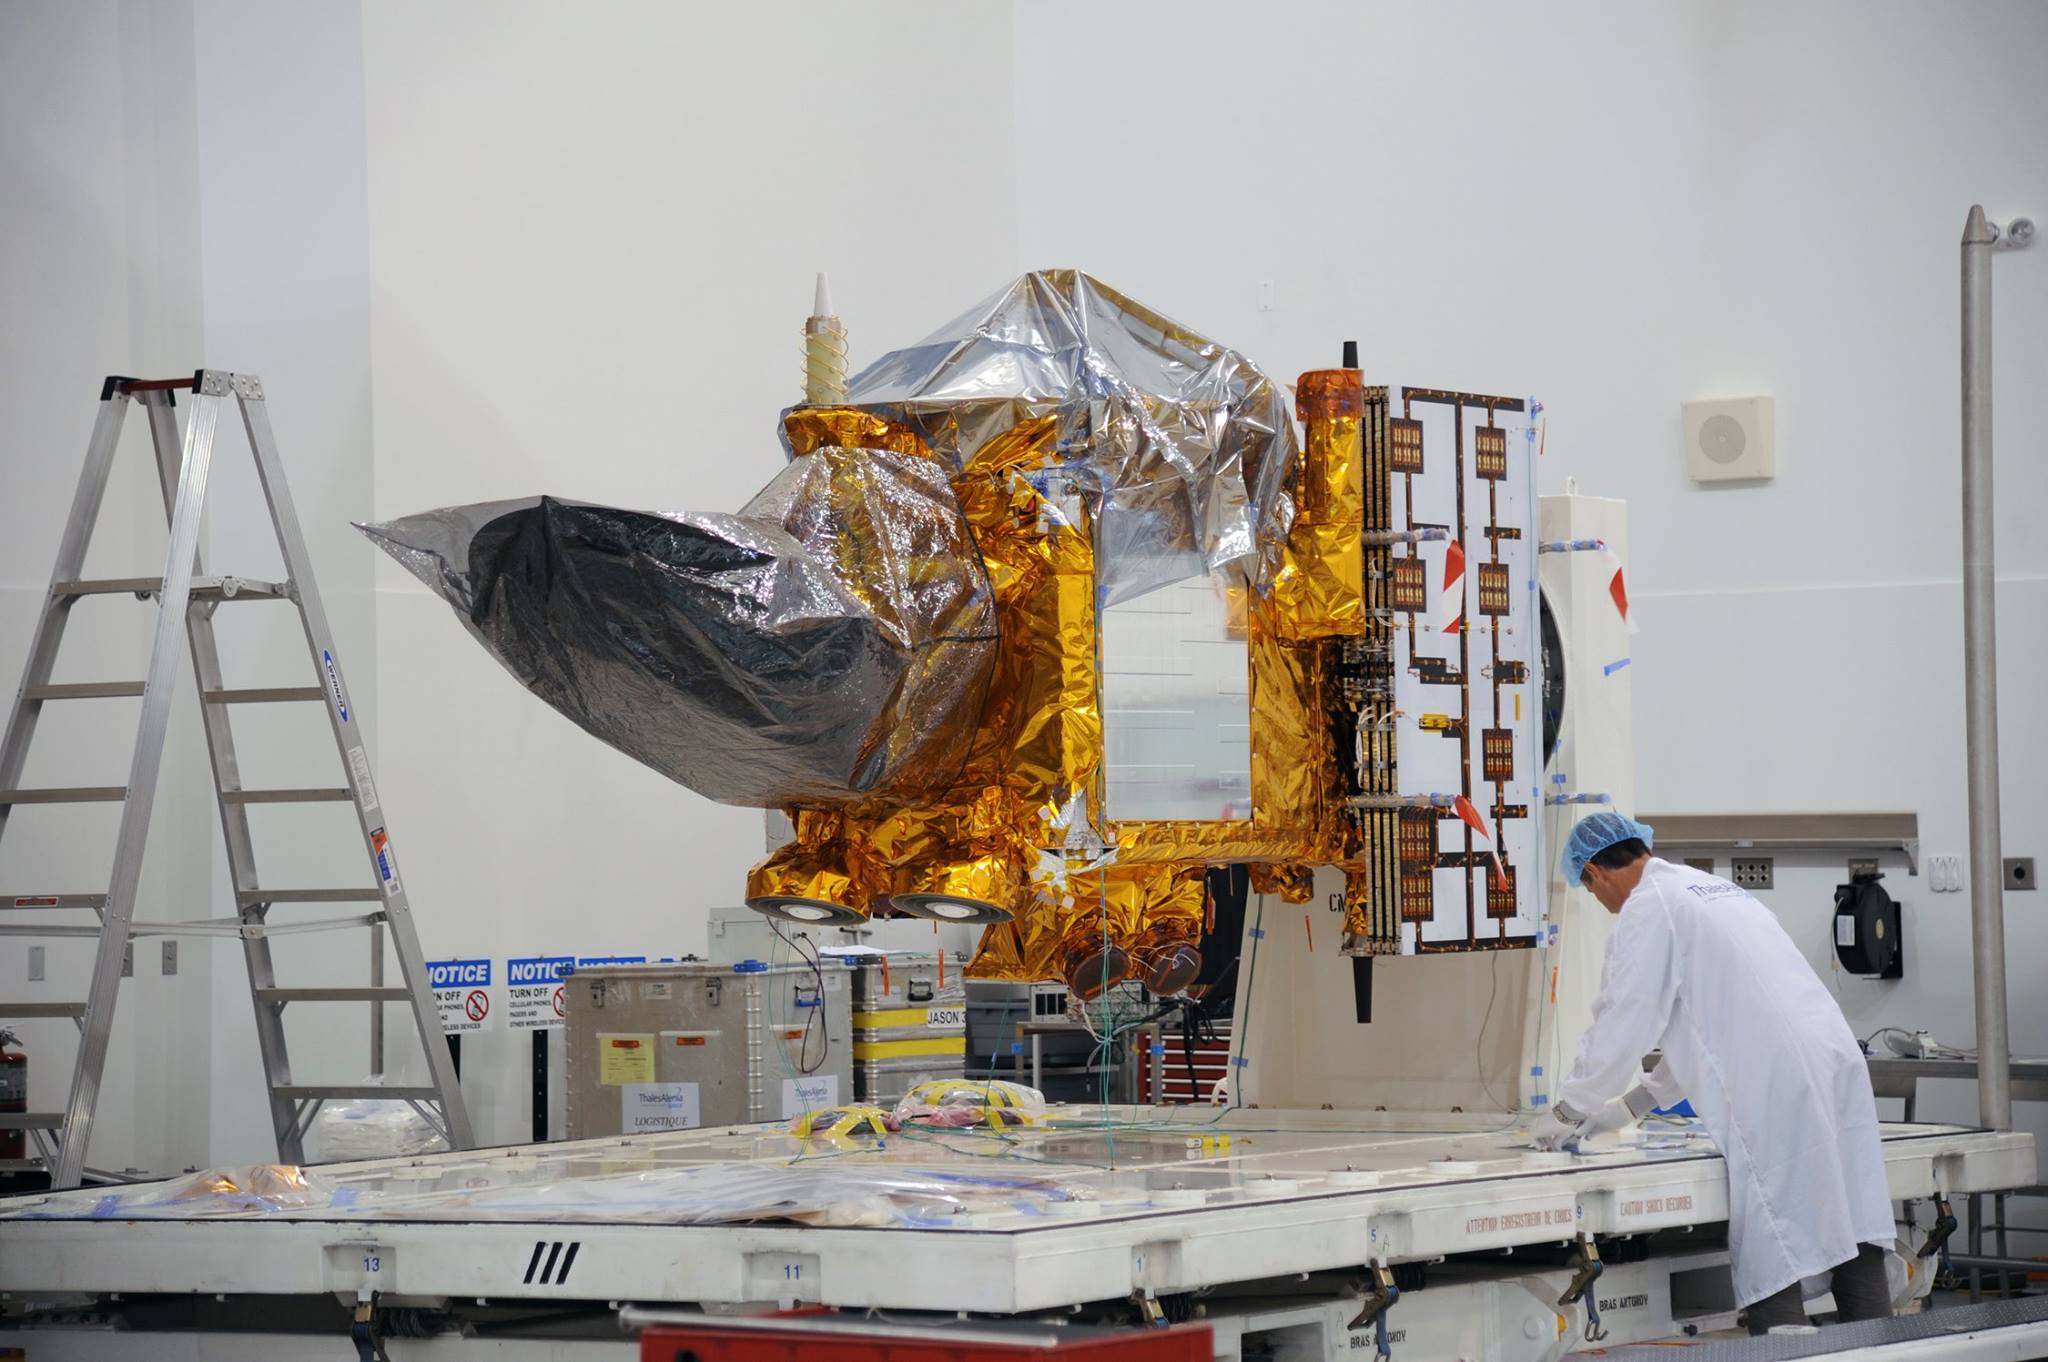
Oceanographer Josh Willis is NASA’s Project Scientist with Jason-3, our latest offering in a series of spacecraft built to monitor and record ocean sea level from low-Earth orbit. Working closely with the European space agencies CNES and EUMETSAT, Josh is recognized as one of the planet’s leading scientists on the front lines of climate research.
The Jason mission has been going non-stop for 23 years, beginning with TOPEX/Poseidon, the first spacecraft in the series launched in 1992. This sustained record of the ocean’s ever-changing surface topography continues with Jason-3, the fourth and latest spacecraft in the series. Two additional craft, now in their design and build phase, are scheduled for launch in 2020 and 2025, ensuring an unbroken record of ocean surface activity and sea level rise through 2030 and beyond.
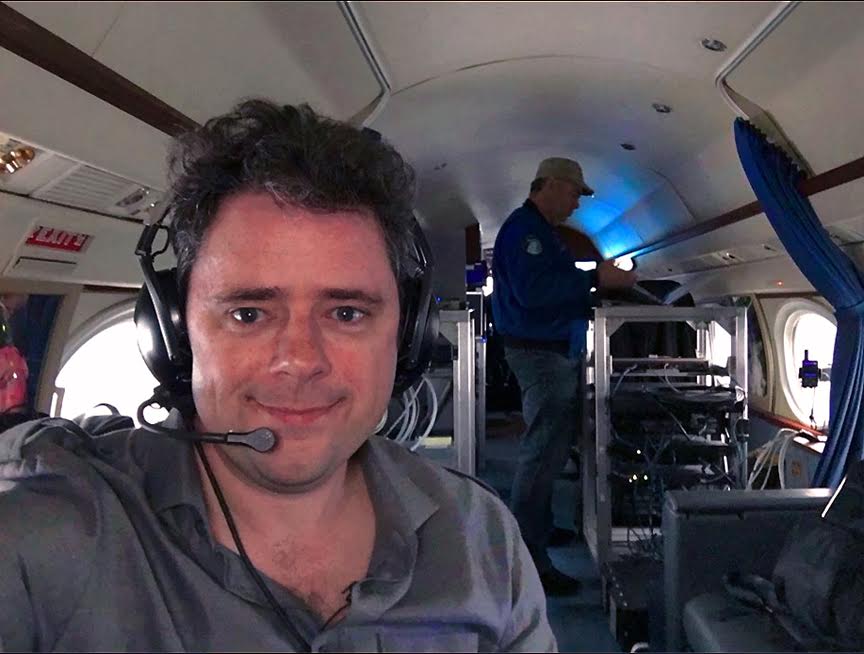
We met the other morning in an office on the JPL campus, a sprawling complex in the foothills of Angeles National Forest near Pasadena, Calif. Josh had just returned from Greenland where he’d been running the first in a series of aerial and underwater mappings of the Greenland Ice Sheet, flying a NASA Gulfstream-III jet. The aircraft carries a mission specific radar known as GLISTIN to record the ice sheet topography while Josh and his team air-drop GPS radio equipped submersibles just offshore from the ice at specified coordinates.
Repeating the survey each Spring over the next five years, the mission will help us to better understand both the physics that are driving the melt, and how rapidly sea level rise in the coming years may play out. Josh calls the program OMG, for Oceans Melting Greenland.
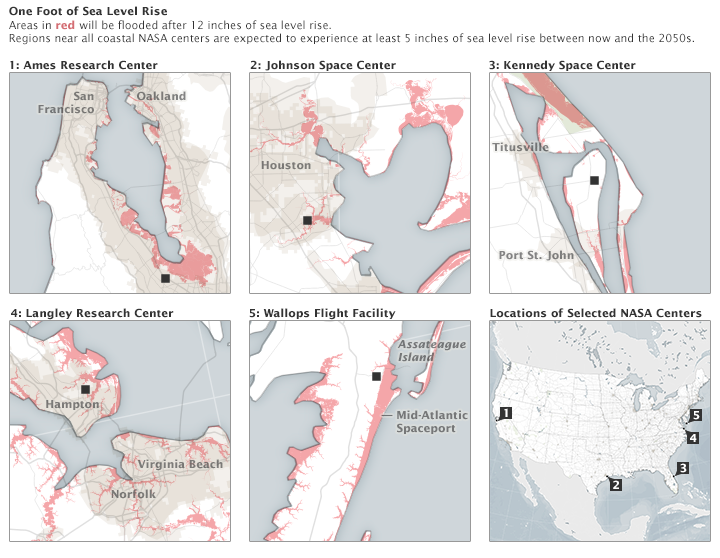
The National Oceanic and Atmospheric Administration, or NOAA, currently offers city planners and coastal communities a map indicating early flooding in low lying coastal areas, the first to be affected by the rising seas.
In this second part of our story, we pick up with the new spacecraft having completed a successful launch, its orbital insertion and calibration phase, and now producing sea level data accurate to 3.5-cm while flying more than 800 miles up, circling the planet in low-Earth orbit.
Jason-3, Part 2
Interview with Josh Willis, JPL campus 7/26/2016
Josh, thanks for sharing your time with us. I hope you don’t mind if we jump right in with some questions regarding the spacecraft and its mission.
Q: Soon after reaching orbit, Jason-3 was placed in a close formation, flying just behind its sister craft, Jason-2; same ground track and altitude. Why the close proximity?
- A: For the first six months or so after Jason-3 reached orbit, both spacecraft have been doing the same thing. Flying eighty seconds apart, 830 miles up (1336-km), measuring the same ocean, the same atmosphere from the same altitude. We do this with each successive mission to calibrate the instruments aboard the new spacecraft. This way, we’re sure to have accurate readings from Jason-1 to Jason-2 to Jason-3, all the way back to Topex. It’s how we maintain consistency, making sure we understand any differences in the two craft before moving Jason-2 to a new orbit.Flying together, they’re independent, yet each is giving us the same information. Sometime after September this year (2016), the plan is to move Jason-2 into an interleaved orbit with a new track halfway between Jason-3’s. At the equator, Jason-3’s ground tracks are separated by about 300-kilometers. When Jason-2 moves over, the ground track distance between Jason-2 and Jason-3 will be 150-km.With Jason-2 relocated, the mission shifts in time, and the combined global coverage of the two craft goes from ten days to five. So, five days after Jason-3 flies over a particular spot on the equator, Jason-2 will cover that same location.
Q: I’d thought the craft were flying in polar orbit, but their trajectory seems canted more toward the equator. Why is that?
- A: Right, they’re not flying polar. Their orbit’s offset at an inclination of 66º. The reason is to better work with the tides. If the spacecraft were in polar orbit, they’d be flying in sync with the tides. You’d hit the tide in exactly the same place with each orbital pass making it much more difficult to remove the tidal data from the equation. The 66º inclination was carefully chosen from the beginning with Topex/Poseidon in 1992. Over the past twenty-three years, the Jason program has given us the most accurate and extensive tidal records ever made.
Q: When we last spoke, we touched on how the Jason spacecraft and the ARGO submersibles work together. The ARGO floats, sometimes called the weather balloons of the ocean, provide temperature and salinity data at various depths, passively riding the current. How does the data from these autonomous craft play a role in the Jason mission?
- A: ARGO is an array of more than three thousand floats measuring temperature and salinity in the upper regions of the ocean. It’s the top two thousand meters where the greatest temperature and salinity changes occur. Deeper than that, below two thousand meters, there’s very little movement, and change occurs very slowly.So, if the radar on Jason shows the sea level is running high in a specific region, it’s likely due to the expansion of warm water, not just at the surface, but at depth as well. A region with a mass of very warm water in the top thousand meters will stand taller than cooler regions.For example, if the sea-level reads high in the Eastern Pacific during an El Niño, and the ARGO data is telling us that the water in this region is very warm, we know that a thick layer of warm water in that area is causing the change in elevation.Scientists use the data from ARGO after the fact. Its data, and the data from Jason are measured completely independently of one another. There is no signal connecting the two. This is important because it gives us a means to independently cross check one with the other to acquire supplemental information.
Q: The Ocean is said to act as our planet’s single greatest carbon repository, removing more than a third of all the carbon dioxide occurring in our atmosphere. How does water temperature affect the ocean’s ability to absorb CO2? Does the ocean warm as more carbon is absorbed?
- A: Actually, it’s the other way around. An increase in ocean temperature changes the ability of water to absorb CO2. So as the water warms, it becomes less efficient at drawing carbon dioxide out of atmosphere. Right now, roughly a third of the CO2 that we put in the atmosphere winds up in the ocean, so, it’s still removing CO2. But as the water warms, there’s a question about how quickly, how readily it will be able to take up the CO2.It’s hypothesized that during the ice ages when there were natural cycles of warm and cold, some of it was driven in a kind of feedback perpetuated by CO2. You’d get a little bit of warming in the ocean, the ocean would release CO2 into the atmosphere, and you’d get a little more warming, and so on. This is what we’re seeing today. The worry is that as we add more CO2 to the atmosphere, the oceans may start to cough up more CO2, or at the very least, be less efficient at drawing it down, and in the long run exacerbate the problem.
Q: How do oceans store CO2? Is it held in sediment on the ocean floor, or is it carried in the water?
- A: Carbon dioxide dissolves in ocean water in a way similar to how a soft drink is carbonated. When CO2 is absorbed at the ocean surface, it reacts with the water to form carbonic acid. Typically, ocean water has a pH that’s slightly alkaline, so additional CO2 shifts the pH more toward neutral.
Q: How does this shift in pH affect life in the oceans?
- A: It presents a problem for some species that make their shells through precipitating calcium out of the ocean. The increased CO2 makes it more difficult for them to do that, in some cases even dissolving them.One example is a species of pteropod known as the sea butterfly, a very small free-floating marine snail. Pteropods are members of the diverse zooplankton group, and play an important role in the ocean food chain. They serve as a major food source for both fish and marine mammals, from sardines and herring to the baleen family of whales.As ocean pH becomes more acidic, the shells of the pterapods break down, looking as though they’d been etched with acid. Oceanographers consider the pterapod as the ocean’s equivalent to the “canary in the coal mine,” viewing their health as an indicator of balance in the marine ecosystem.
Q: Is there a way to take all of the variables into account, to catch a global view of the interaction between the carbon, energy, and water cycles and come up with a timeline of possible outcomes? A kind of metabolic prognosticator?
- A: I don’t think we have a comprehensive tool. We have a bunch of tools that we use for different parts of the process. There are satellites like NASA’s OCO-2, the orbiting carbon observatory.The difficulty in measuring CO2 is that it mixes very quickly. So, as soon as it’s emitted, it starts to mix over the entire atmosphere. Within a couple of weeks, particles of CO2 that you and I breathe out are spread across the entire planet. Because it mixes so rapidly, if you want to see sources and sinks you have to measure it very quickly and accurately. That’s what OCO-2, the orbiting carbon observatory, is attempting to do: to look for shifts and changes in the concentration of CO2 in the atmosphere. So, if you take a reading in the southern ocean and find a region where there’s a lot less CO2, the implication is that this is a region where the water is drawing it down, out of the atmosphere. If you look at a region over a coal mine and find an abundance of CO2, it’s because the mining process is dumping great quantities into the atmosphere.
Q: So, when you compare data from both Jason and OCO-2, does the big picture begin to emerge?
- A: Well, other people are looking at OCO-2. And there are people who really try to combine all the information; groups like the IPCC (the Intergovernmental Panel on Climate Change) where you pull hundreds of scientists together to make sense of it all. But you know, much of the science is still done in “stove pipes.” So, the carbon folks look at the OCO data, the oceanography folks look at the Jason data, the glaciologists look at the glacial data. We’re beginning to try and break through some of those pipes and work together, but it’s an ongoing process.
Q: Anybody playing with AI (artificial intelligence) to combine all the disciplines?
- A: (Laughter) A good question. I’m not allowed to say … just kidding. More like I’m not allowed to know (more laughter). If there is top-secret stuff, they don’t tell me about it.
Q: Can you tell us something about the upcoming Jason-CS mission coming up in 2020?
- A: It’ll be similar to Jason-3, but a little more advanced. There’s a new radar that will provide higher resolution along the track. It’ll fly in the same orbit. And actually, it’s not one satellite, but two. They’re building both at the same time. The first will launch in 2020, and the other in about 2025. So, between them, they’ll extend our climate record out to 2030. Designated Jason-CS-A and Jason-CS-B, they’re being built by ESA using a different satellite bus, but the guts of them are pretty similar to past missions.Some small improvements are being made to ensure climate record stability. For instance, we’re adding a radiometer to the satellite to measure the water vapor in the atmosphere, and improving the long-term stability of the radiometer with a new instrument on the Jason-CS missions. Longevity with the Topex and Jason missions has been great, but occasional drifts have had to be addressed and instruments re-calibrated by outside sources. Also, building the two spacecraft together will save some money and ensure the ongoing, long-term record be maintained.
Q: How can the public stay informed, not only on the Jason missions, but the Oceans Melting Greenland research as well?
- A: For the Jason missions, there’ll always be sealevel.jpl.nasa.gov. That’s a website that tracks the news and science results of Jason-2 and 3, and hopefully the Jason-CS missions in the near future. For Oceans Melting Greenland, you can go to omg.jpl.nasa.gov. Also, you can follow a page I maintain on Facebook tracking some of my climate related stuff – you can find me at Climate Elvis.
————————————————————————–
Coming up, we’ll speak with Josh about the Greenland OMG expedition, how the study relates to the Jason series, what to expect, and how to prepare for changes already playing out on our warming planet and rising seas.
The Jason-3 mission is an international partnership between the National Oceanic and Atmospheric Administration (NOAA), NASA/JPL, the French Space Agency CNES, and Europe’s EUMETSAT.
You can read part 1 of our interview HERE.
- Special thanks to JPL’s Alan Buis, Josh Willis, and Carol Rasmussen for their gracious support.
.
Be sure to “Like” AmericaSpace on Facebook and follow us on Twitter: @AmericaSpace
.
Missions » JASON-3 »

Ask the people of Doggerland. Or the nearby North Sea barrier islands.
No, the seas have not been at a steady level for millennia. They have generally been rising ever since the last Ice Age.
The unadjusted measures taken from satellites show no rise in the average temperature of the Earth (and they generate an actual average temperature). It is only when the AGW fraudsters adjust the temperature of the surface record there is any warming in that record, and the warming they have produced is not in sync with the ppm CO2 anyway, and it is not unusual in the temperature record in any case. Even if it were, even from the AGW fraudsters own theories, the greatest warming we could expect would put us closer to the temperature of the Holocene Optimum, and the wealth permitted by that level of CO2 PPM would position the human species to deal with the few downsides of that temperature range very well–far better than the much poorer humanity they seem to prefer could tolerate the colder temperatures they claim are “normal”.
They not only have fraudulently created a fake problem, the fake problem is far better than their solution!
You must be sent to re-education camp ASAP!
The NewSpace crowd is well populated with libertarian climate deniers. Disgusting.
The desire of the global warming fraudsters to bring about the prompt deaths of hundreds of million to falsely satisfy their moral vanity is disgusting.
A good thing is you are probably young enough you will live to see your fraud entirely unravel.
“Prompt deaths of hundreds of millions” huh? Wow.
What a bunch on freaks the NewSpace groupies are. Creepy, arrogant, disingenuous, and delusional.
Orwellian that the “fraudsters” are the ones accusing everyone else of lies and conspiracies when they are the ones who will say absolutely anything to advance their cult. As long as it does not contradict the perceived will of their John Galt/Tony Stark fantasy icon then anything is permitted. Except they can even change that false reality as needed. Witness the cognitive dissonance of their demigod being a climate change advocate while they spout bizarro libertarian denials. It is truly disgusting and they are without doubt dregs at the bottom of the septic tank.
Uhuh. Nonsense is clearly your forte.
Mr. Musk one of the idiot AGW fraudsters, although I belive that is only s a deluded believer.
You my have noticed he is NewSpace.
What you will not have noticed and can never cite is so much as one climate model the AGW fraudsters use which can be run backwards with the unadjusted temperature record as an input, which can replicate the known past, or for example use the known temperature record ending in say 1990, and then successfully predict the next 25 years.
There are no CO2 “forcings” as the catastrophists’ models require for their validity.
AGW is bunk.
~ Mr. Musk one is of the idiot AGW fraudsters, although I believe that is only as a deluded believer. ~
Sigh. I really need to get a new PC in the living room. I’ve noticed if I am typing at speed it simply will not register all keystrokes. If I deliberately slow down it is fine. Not that I should object, it’s 7 yo and was a floor demo model at 75% off at that. I’ve more than gotten my money out of it.