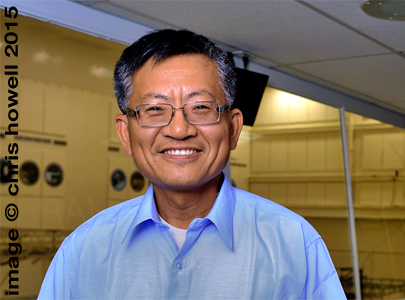
A meeting in two parts with NASA/JPL’s SMAP Project Scientist/Aquarius Project Scientist (scatterometer) Dr. Simon Yueh
In a three-year follow up on the Aquarius spacecraft and its mission to map ocean salinity and soil moisture from low-Earth orbit, we spoke with JPL Project Scientist Simon Yueh on how weather patterns emerge through Earth’s dynamic water cycle; how soil moisture is a vital component within the cycle, a key to predicting crop yield, rain fall, flooding, and drought; how Aquarius has been working in concert with ESA’s Soil Moisture Ocean Salinity spacecraft, SMOS; and how Aquarius’ data will compliment the high-resolution soil moisture mapping of SMAP, NASA/JPL’s soon to launch Soil Moisture Active Passive spacecraft.
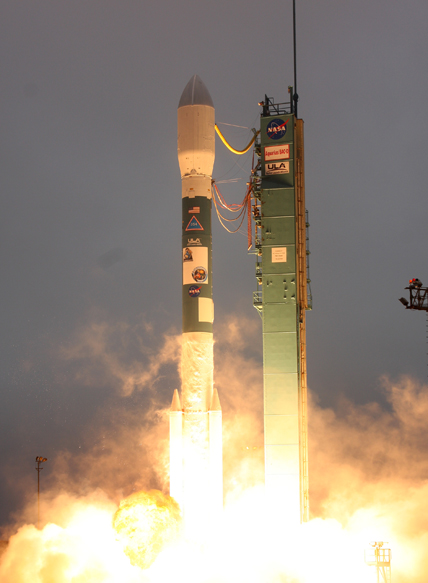
Flying atop a Delta II 7320 rocket out of California’s Vandenberg Air Force Base in June 2011, the Aquarius/SAC-D spacecraft, a joint mission from JPL/NASA and CONAE, the Argentine Space Agency, eased into a “terminator orbit,” a polar route locked just inside the shadow line of our rotating Earth.
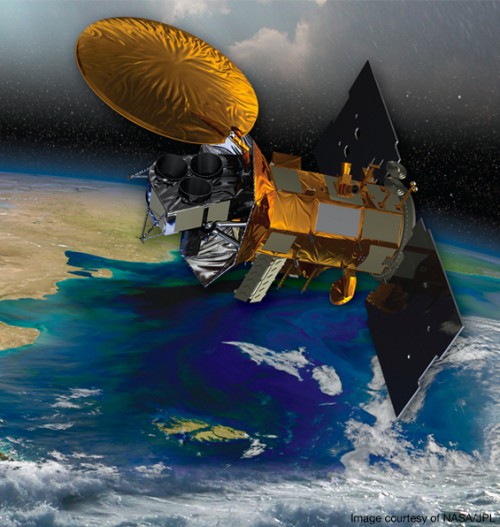
In the first three years of its mission, Aquarius has given us stunning data, revealing previously unknown physical interactions between the water and atmospheric cycles of our planet that shape our global weather patterns.
Near the ocean’s surface, salts within the water store heat from the Sun. Displaced by lighter freshwater arriving from rainfall, glacial melt, rivers, and streams, the heavier saline rich water sinks into the depths. Carrying solar heat as it descends, sub tidal convection currents are born through vertical mixing. By measuring the density, variability, and circulation of salt within the ocean, we learn how our planet’s changing climate and global water cycle are linked.
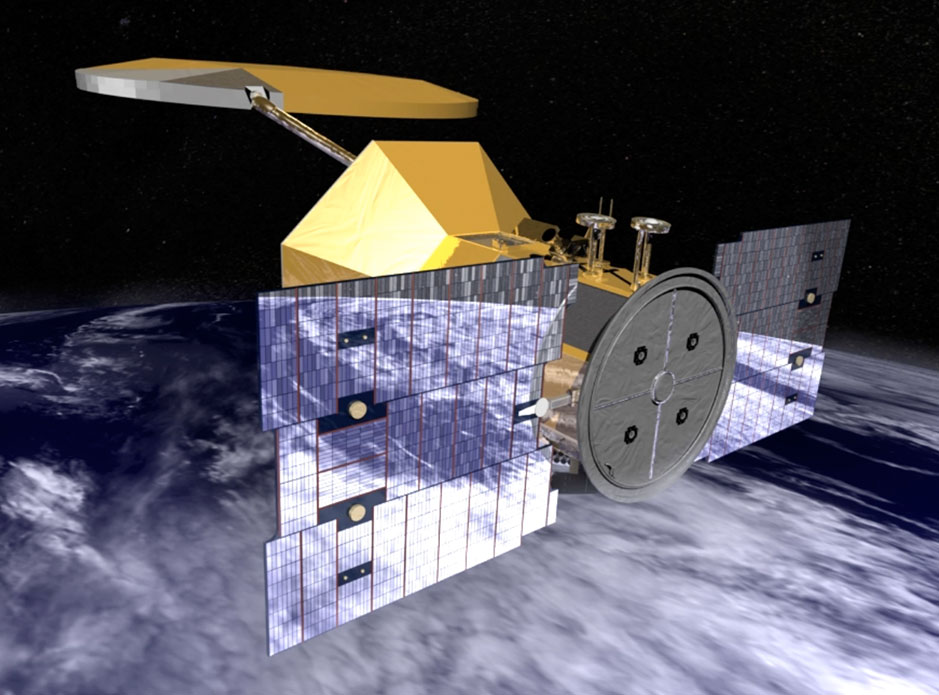
Aboard the Aquarius instrument, three passive microwave radiometers monitor a swath on the planet’s surface 400 kilometers wide as it travels above. Sharing the same antenna, a second instrument, an active radar scatterometer developed by JPL, paints the path below with a radar pulse, measuring the surface roughness, or reflectance, of the water. The combined data from these two instruments is used to create a global map of our ocean’s surface salinity, refreshed each week and accurate to two parts per ten thousand.
The following interview with Dr. Simon Yueh, NASA/JPL Project Scientist, took place Sept. 22, 2014.
- Q: In the 3.5 years since the Aquarius mission has been in service, what knowledge have we gained to better understand the planet’s water cycle and its relationship to changing weather patterns?
A: There are quite a lot of interesting discoveries the science community has been finding from the Aquarius data over the ocean. The dynamics involving fresh water from precipitation and how it mixes with upper layers of the ocean is of special interest. Aquarius measures salinity at the surface. We also use ocean buoys, but readings use conductivity sensors to measure salinity at a depth of about five meters or deeper, a depth at which algae is less likely to grow.
We know that the surface layer, aerated by wave motion and carrying warm water in the tropics, is conducive to algae growth. Sensors placed closer to the surface would become fouled with algae and no longer function. At a depth of five meters or below, algae growth is discouraged; the increased salinity at depth acts much the same as chlorine would in a swimming pool.
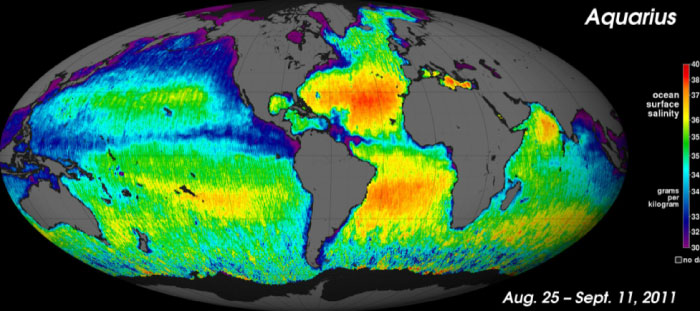
The ever-changing salinity dynamic in the top five meters of the oceans has recently become a topic of great interest to oceanographers and climate scientists. Its understanding is now seen as a key factor in predicting weather patterns and changing climate.
- Q: JPL/NASA has a fleet of 19 Earth Science spacecraft engaged in climate studies. Is Aquarius working in concert with other craft as well to gather data on the planet’s water cycle and shifting climate?
A: There is another mission launched by the European Space Agency in 2009 known as SMOS, the Soil Moisture and Ocean Salinity mission. The key focus of the mission is soil moisture followed by ocean salinity.
- Q: Comparing the ESA craft, SMOS, to Aquarius, how do they differ?
A: In terms of penetration depth, they are the same. SMOS covers a wider swath, 1000 kilometers wide with each pass. While the swath of Aquarius is less wide at 400 kilometers, the Aquarius’ radiometer is more precise. Also, Aquarius and SMOS are flying in sun synchronous polar orbits, but opposite crossing time at equator. The Aquarius crosses the equator from south to north (ascending) at about 6pm local time and from north to south (descending) at about 6 a.m. local time, while the SMOS orbit is opposite. Taken together, the information from each of the two craft complement one another other quite well.
- Q: Was soil moisture planned as a part of Aquarius mission, or did it become a plus after the fact?
A: It became a plus in the mission. Soil moisture measurement was known to be a role Aquarius could play, but it was never thought of as the primary mission.
- Q: A region in the North Atlantic known as the Sargasso Sea is said to have the highest salinity of any of the world’s oceans. Referred to as a desert on the ocean, does the Sargasso help us to understand how the process of desertification takes place on land?
A: This area, the Sargasso, was first investigated by NASA two years ago in a study called SPURS (Salinity Processes in the Upper Ocean Region Study). What’s interesting is that when the SPURS data is analyzed in conjunction with the data from Aquarius, the conclusion is the ocean is much more dynamic than scientists had thought in the past. So, it’s not really a desert. There are a lot of activities going on in the region.
It was thought, in the past, that because the region is dominated by high evaporation and so little precipitation—no rain in the area—the salinity should follow the evaporation pattern pretty well. But then it turned out that that’s not really the case. It’s what we call horizontal advection, and also, vertical mixing. Horizontal advection corresponds to the ocean current redistributing waters of different salinities horizontally. Vertical mixing is the exchange of waters at different depths with different salinities.
Earlier in our conversation you mentioned fresh water outflow from rivers. Near the equator the river that produces the greatest outflow is the Amazon. What we’re seeing now is that the outflow from the Amazon River can affect (the ocean salinity for) more than just a few hundred kilometers. We found that sometimes large pockets of fresh water from the Amazon can break free, follow the current across the Atlantic, and move toward Africa. This is really amazing. The thought has been that when the fresh water from the Amazon comes out, it would mix quickly with the ocean within a few tens of kilometers or maybe as much as a hundred kilometers. But it’s more than that. Now, we’re seeing that the ocean can carry that fresh water pocket for a much longer distance.
- Q: What do you think may be causing these pockets of fresh water to hold together?
A: We don’t know. It’s pretty interesting. This is something for the scientists to ponder. There’s a lot of information that still missing. So, this is an area in which we’re still learning.
- Q: Do we have enough instruments in play now, or do we need more to better evaluate the data? Are we missing anything?
A: For the oceans, we always need a combination of in situ buoys, which can either move freely with the ocean current, or be fixed on moorings to the ocean floor. The data from the buoys is always limited to its spatial sampling. It would be unrealistic to have moored buoys throughout the ocean. It just wouldn’t be possible. It would be too expensive to do that. And so, the satellite gives us a global view of what’s going on. The Aquarius mission has been going along pretty well. And in fact NASA is going to launch a new mission in a few months called Soil Moisture Active and Passive, or SMAP.
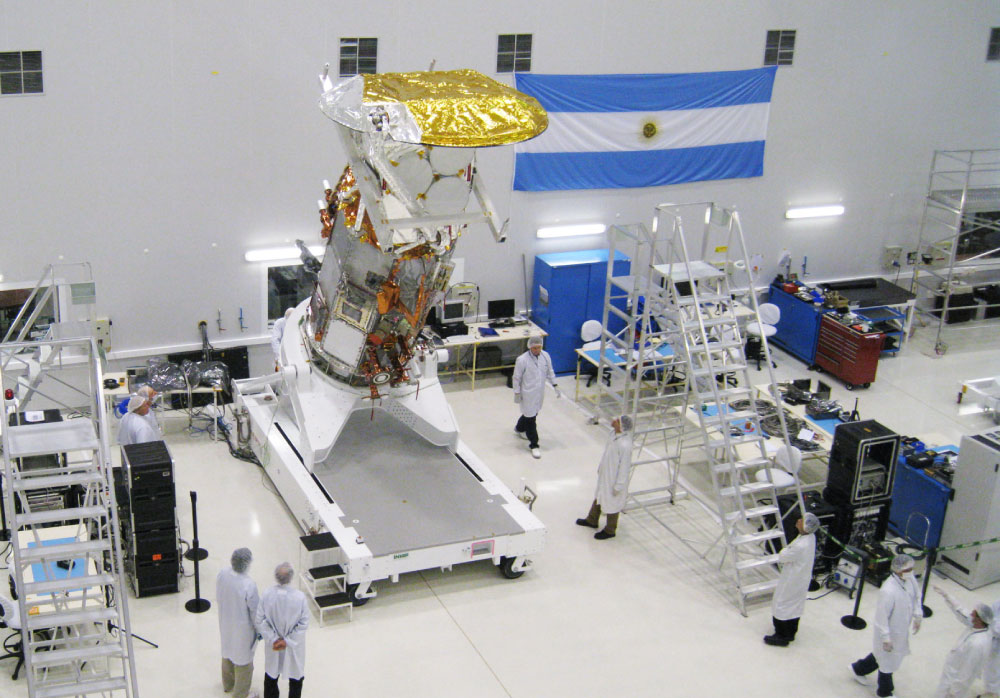
Earlier we spoke of the Aquarius spacecraft using a fixed dish antenna and three radiometers and rather than a single rotating antenna. In those days, 5 or 6 years ago, a rotating antenna presented some problems. Since then, we’ve developed new technology to rotate a big antenna. So this new mission called SMAP has the instrumentation Aquarius has, the radiometer, the radar, but together with that, it also offers a big antenna, 6 meters in fact. The Aquarius antenna is 3 meters, so this will double it, plus, we’re going to rotate it. So, this craft will give us a 1000 kilometer swath with a higher spatial resolution of about forty kilometers.
- Q: So, with a 1000 kilometer swath, it’ll be able to map the planet, not once a week, but every three or four days?
A: Yes, every three days. And, of course, it will acquire data over the ocean all the time. The primary focus of SMAP is the soil moisture over land. Just like Aquarius, we expect the ocean salinity and the ocean vector wind product will be a plus for SMAP. This will be happening sometime next year. The mission will be launched in January 2015. Starting as early as April 2015, SMOS, Aquarius, and SMAP, all operating on the same frequency, will begin working together in concert and should be operating for many years. I think it will be very exciting, very interesting.
- Q: Speaking of exciting things to come, is there anything on the horizon that that really peaks your imagination?
A: Spatial resolution and temporal revisit. We’re seeing more than just a revolution in technology. NASA is really pushing the technology from smaller to bigger coverage with higher resolution creating even more powerful tools for the scientist. At the same time, we’re gaining new insight, even in those areas over the ocean that we thought we understood pretty well in the past.
- Q: So, this insight has to do with a better understanding the dynamics of surface and subsurface currents and how they function?
A: I think with the information we are now learning from Aquarius, we are learning to go back and re-assess, to re-evaluate the role of the vertical mixing and also the horizontal advection in the ocean dynamics. So, even for a region we think is dominated by evaporation, or for some reason, dominated by precipitation, now the general picture is we can only grasp these as hypotheses. Horizontal advection, vertical mixing, evaporation, precipitation: all these play an important role at different times, at different scales and resolutions.
For example, another very interesting science phenomena discovered by Aquarius is what we call the tropical instability wave across the Pacific and the Atlantic. This is a new discovery by Aquarius. That kind of information has been seen in the past in the ocean surface temperature images a few degrees north of the equator. But Aquarius is providing a new picture of information that these kinds of waves also exist near the equator, but can only be seen in the salinity data set.
The other example is the river outflow. Standard thinking has been that the fresh river outflow from the Mississippi River would only affect the coastal region near Texas, Mississippi, and Louisiana. The Aquarius data has now shown that the fresh water on the surface can reach all the way to the southern end of the Gulf of Mexico. In the winter, when there’s not much precipitation in the region, then in the summer when there is precipitation, we can see that salinity cycle in the upper ocean through the Aquarius data.
Another example I’d like to tell you is pretty interesting; it’s something that we’ve just started to understand. It’s a combination of how useful it is to combine the whole motion image salinity together. One of the interesting regions for the oceanographer or the climate scientist is the ocean surrounding the Indian Subcontinent. Why is that region so important? They have a monsoon season, right? In June-September, they get a lot of rain. So the heavy precipitation and river run-off dump vast quantities of fresh water in the Bay of Bengal. We also have heavy precipitation over the open ocean in the same region. When we start to look at the soil moisture changes over the continent, and the salinity changes in the ocean, we can see their time correlation. Then, we can see when the fresh water will actually reach the southern point in the Bay of Bengal. But there’s something else, more than just the fresh water coming into the Bay of Bengal. There’s also a current in the Bay of Bengal, and that current can change direction in winter and summer. So, we can see how everything plays together, with fresh water coming out of the Ganges, Irrawaddy, and Salween Rivers, and then the ocean current actually moving the fresh water around in the Bay of Bengal.
- Q: You noted that freshwater outflow from the Amazon has been found to travel a great deal farther into the Atlantic than had been thought, at times reaching almost to the African Continent. Do fresh water pockets from rainfall hold together in a similar way to those of fresh water outflow from large rivers such as the Amazon?
A: In the tropics, in the Pacific and also the Atlantic, there are what we call inter-tropical conversion zones. These zones occur near the tropics where wind develops between the northern hemisphere and the southern hemisphere. In the Pacific, this region produces more rain, more precipitation, than the Atlantic. The traditional thought, before the Aquarius mission, was that when the fresh water comes down as rain, it would form a fresh water layer on the surface, then mix very quickly, vertically, with the ocean. If this were the case, we should not see a fresh water layer on the surface for too long. The speculation from the Aquarius data is that it has to do with local wind conditions. When the surface is calm, when the wind is low, the fresh water layer can stay longer. Then, when the wind is stronger, the vertical mixing will be more rapid.
- Q: When the mixing becomes more rapid and the convection currents increase does that affect the weather pattern?
A: There is a recent study that indicates that this could be the case. A group of scientists have looked at data from Aquarius and SMOS taken over the Amazon River plume in the western Tropical Atlantic Ocean during the time of Hurricane Katia. They observed, in unprecedented detail, a phenomenon of the freshwater outflow from the Amazon/Orinoco plume, a vast, warm water surface barrier layer, remaining largely intact, crossing much of the Atlantic Ocean, and approaching Africa.
We know that warm water is a key factor for hurricane formation and intensification. Since the Amazon plume contains pretty warm water, it’s likely to play a role in the formation and intensification of hurricanes. In the case of Hurricane Katia (which had formed earlier off the west coast of Africa near the Cape Verde Islands), the storm grew in size and strength when it reached, and then began to pass over an unusually large Amazon plume carrying freshwater at temperatures greater than 29° C (>84.2°) F, causing it to intensify into a category 2 hurricane.
Normally, strong winds associated with hurricanes create strong vertical mixing. So when a hurricane is travelling in open water with no warm, fresh water plume (barrier layer) beneath it, the colder water, upwelling from below more easily reaches the surface making conditions less favorable for following storms to grow.
What Aquarius has shown in the study of Katia is that the freshwater plume, the warm water barrier layer, remained relatively intact after the hurricane passed over. With little vertical mixing taking place, the plume retained its heat, remaining a hotbed for hurricane intensification, standing ready to increase the strength of the next storm that might pass its way.
Author’s note: Further studies taken from Aquarius and in situ data suggest that the surface depth of the plume, the thickness of the barrier layer, may play an important role in whether the surface winds of the passing hurricane cause it to break up through vertical mixing, diminishing the storm’s strength, or remain intact, its heat energy continuing to increase the intensity of the hurricane.
Next episode: The coming of SMAP, Aquarius Sets the Stage
In our next meeting with NASA/JPL’s Dr. Simon Yueh, we’ll explore the expanded mission of Aquarius to include the overland mapping of soil moisture. Working in concert with the European Space Agency’s Earth science spacecraft, SMOS, Aquarius sets the stage for an even more comprehensive, higher-resolution soil moisture mapping by SMAP, NASA/JPL’s soon to launch Soil Moisture Active Passive spacecraft.
Special thanks to JPL Media Specialist Alan Buis, Dr. Simon Yueh, JPL/NASA SMAP Project Scientist, Annette deCharon, Senior Marine Education Scientist, University of Maine, School of Marine Sciences.
Want to keep up-to-date with all things space? Be sure to “Like” AmericaSpace on Facebook and follow us on Twitter: @AmericaSpace
Missions » SMAP »
